Assets & infrastructure
Management information that is not a monthly return
Dashboards, indicators and open data drawn from the same records the departments work in.
Why it matters
A figure and the files behind it, one click apart
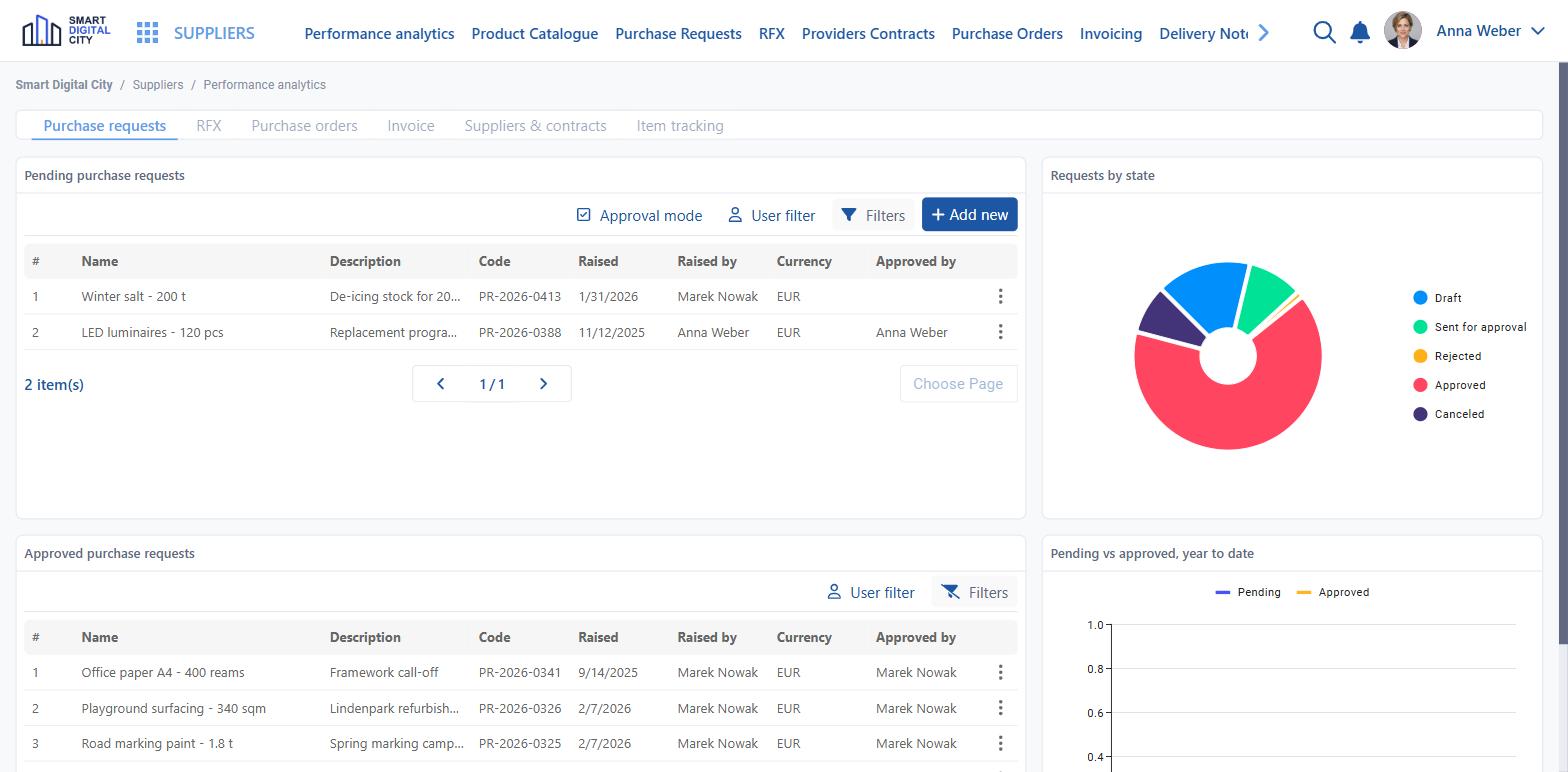
Most administrative reporting is retyped: departments assemble numbers by hand, management receives them late, and nobody can drill into a figure they doubt. When indicators are computed from the operational records, the figure and the files behind it are one click apart.
Computed from operational records
Indicators are read from the work, not assembled from it.
No retyping between departments
Nobody prepares numbers by hand for someone else.
Drill from the indicator to the file
A figure that looks wrong can be opened.
What it provides
Numbers with the files behind them
The same definitions serve the department, the management board and the public.
Operational dashboards
Backlogs, ageing and deadlines per department and per service.
Service performance
Volumes, completion rates and time to decision, service by service.
Financial execution
Committed, spent and remaining, across budget and projects.
Asset and works indicators
Condition, cost per asset and maintenance backlog.
Drill-down
From an indicator to the actual files behind it, with permissions respected.
Open data
Published datasets refreshed automatically, in machine-readable formats.
How it works
Defined, computed, published, investigated
One definition per measure, and no hands between the record and the figure.
01
Define the indicator
Each measure states what it counts and from which records, so two departments cannot compute it differently.
02
Compute from the source
Numbers come from live records; nobody prepares them, and nobody can adjust them on the way up.
03
Publish to the right audience
Management, department heads, elected members and the public each see the views intended for them.
04
Investigate a figure
A surprising number can be opened down to the files that produced it, within the user’s permissions.
Outcomes
What changes
Reporting stops being a monthly exercise and becomes a property of the system.
Numbers nobody retypes
Reporting stops consuming departmental time.
One definition per indicator
Comparable across departments and periods.
Open data without a project
Publication refreshes itself.
Configured per administration
What is configured
- the indicators defined, and how each is computed
- dashboards per role and per department
- refresh frequency and historical retention
- drill-down permissions
- the datasets published as open data
- formats and licences for publication
- alert thresholds and who is notified
- exports for statutory reporting
Connected to
The rest of the platform
- Every solution on the platform, as the data source
- Budget and financial operations
- Assets, works and utilities
- National statistics and open data portals
On your own indicators
See indicators computed on live records.
We take the figures your management asks for each month, define them once, and show them computed — with the files behind each one still reachable.